OUR DATA PORTAL

Tag: data visualization

Data and Visualization for Intelligence Analysts

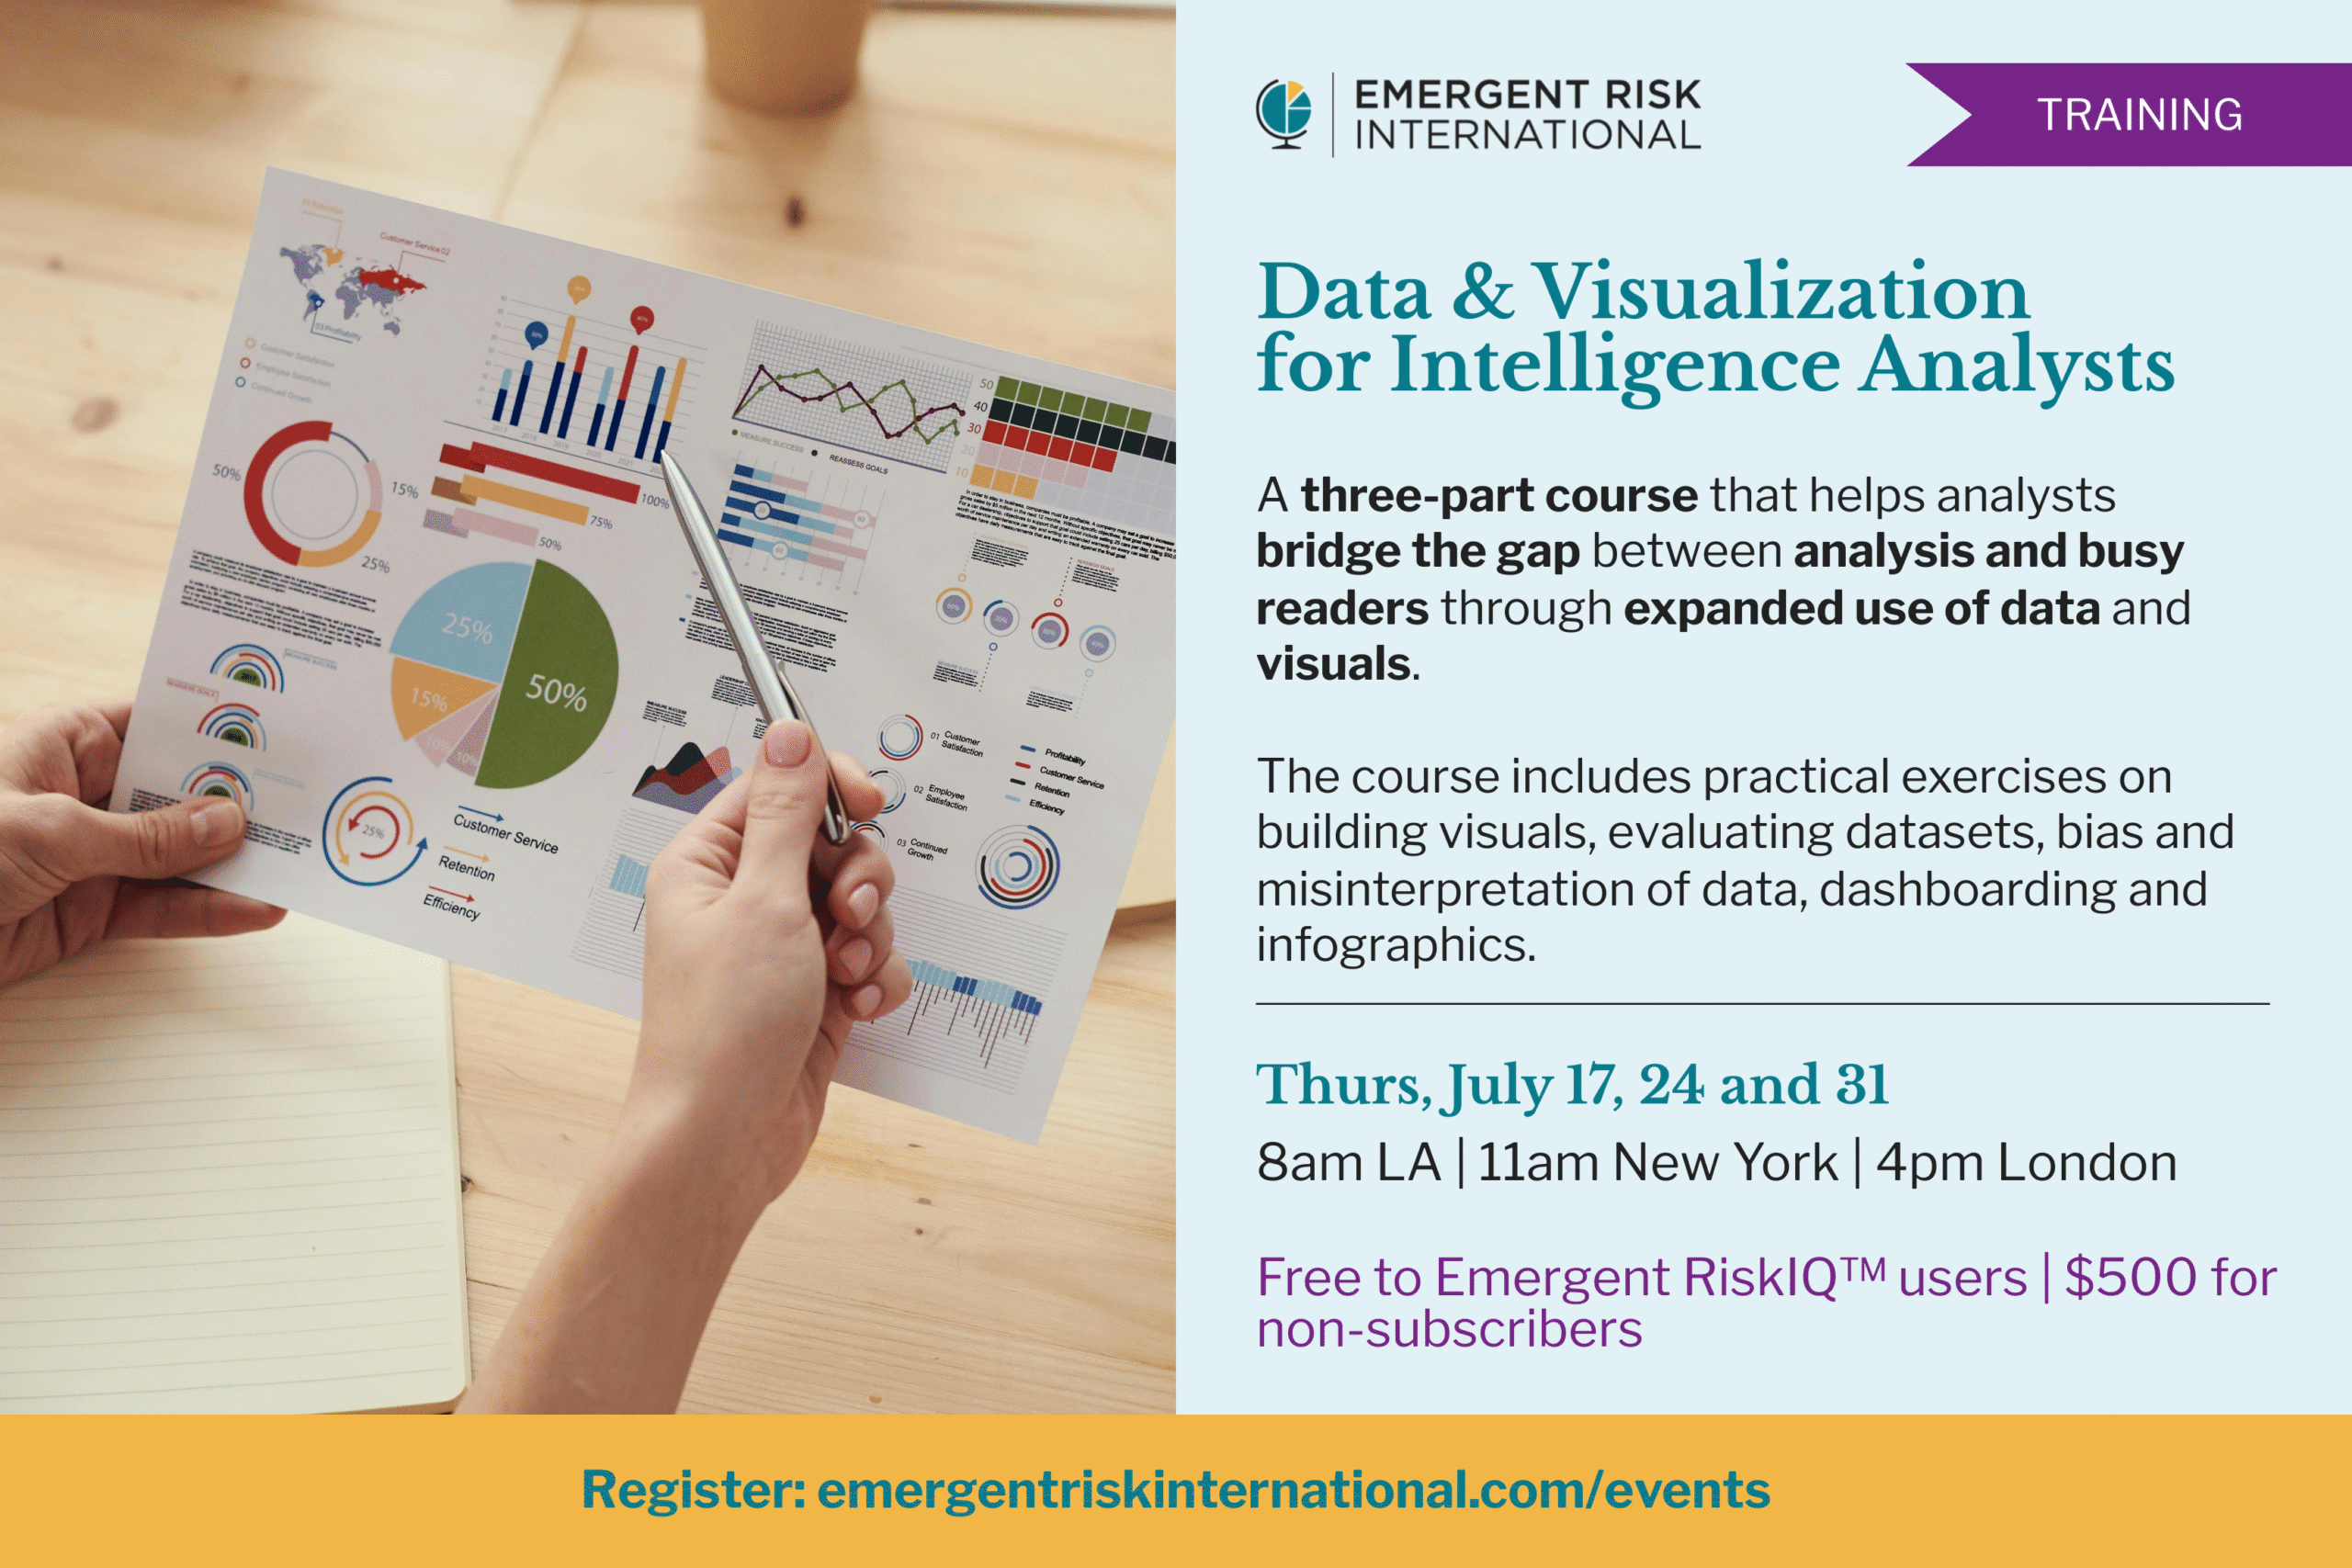
This is a three-part training designed for intelligence analysts to help them learn more about using data and visualizations effectively. This training will equip analysts with the tools and knowledge to expand their use of data and visualizations to be more effective and deeper – helping them bridge the gap between their analysis and their busy readers who don’t always have time to take in a longer form paper. The course will include familiarization exercises on building different types of visuals, evaluating datasets, understanding the importance of using data in our analysis, bias and...

Continue reading

Using Visuals to Tell the Story

Join ERI’s Client Relations team Huw Longmore and Iman Elbanna as they discuss best practices for using data-driven visuals to engage your readers and improve your analysis. They’ll chat with ERI’s lead Europe and South and Central Asia analyst Pearl D’Souza about ways to use maps, charts, graphs and graphics to add context and make your analysis more digestible. This webinar is free for ERI Situation Room, Analysis and Training subscribers and $50 for non-subscribers.

Continue reading

Sign up for our Newsletter

Sign up for our newsletter to receive our monthly intelligence briefing, infographics, and updates on the latest events. (And we promise we don’t do spam).